Using the Relative Strength Index Indicator
When it comes to becoming a consistently profitable trader, one thing that you need to know all about our technical analysis indicators. When it comes to forex trading, and everything else too, technical analysis indicators are extremely important for you to know. One of the most important technical analysis indicators that you should know about is called the relative strength index or RSI for short.
In case you don’t know what an indicator is, these are the foundation of technical analysis in trading. Indicators provide you with a plethora of important information about current and past price movements. They are therefore designed to help you predict future price movements. There are four different kinds of indicators out there, and these include momentum, trend, volume, and volatility indicators.
Momentum indicators are extremely important, and this is exactly what the RSI or relative strength index is, a very useful momentum indicator. What we’re going to do today is to provide you with all of the information that you need to know about using the relative strength index to make profitable trades our very own Andrew has provided us with some amazing video guides that will tell you exactly how to use their relative strength index to make profits on a daily basis.
What is the Relative Strength Index?
The RSI or relative strength index is an indicator that was first developed back in 1978. It was developed by J. Welles Wilder Jr in his book, New Concepts in Technical Trading Systems. Since it was first created, this indicator has become extremely popular, and the reason for this is quite simple, because it works very well.
What you do of course need to know here is that when it comes to the four types of indicators, the relative strength index is a momentum indicator. This means that it measures how momentous or strong that recent price changes were. You can then use this information to figure out whether an asset is overbought or oversold, as well as overvalued or undervalued. If you know whether or not it asset is overbought or oversold, it then allows you to place trades based on trend reversal.
what is also important for you to know is that the relative strength index is known as an oscillator, or in other words it oscillates, or moves up and down between various values, and these range from zero to 100. Therefore the RSI or relative strength index is a very useful indicator as it can provide you with info about the bearish momentum or bullish momentum of the specific stock, security, or asset.
Interpreting the RSI
Of course, knowing what the RSI is, is extremely important, but it’s totally useless if you don’t know how to read it or interpret it. You absolutely have to be able to interpret the relative strength index in order to use it to place profitable trades. When it comes to interpreting the relative strength index, there are just a few extremely important things that you need to know.
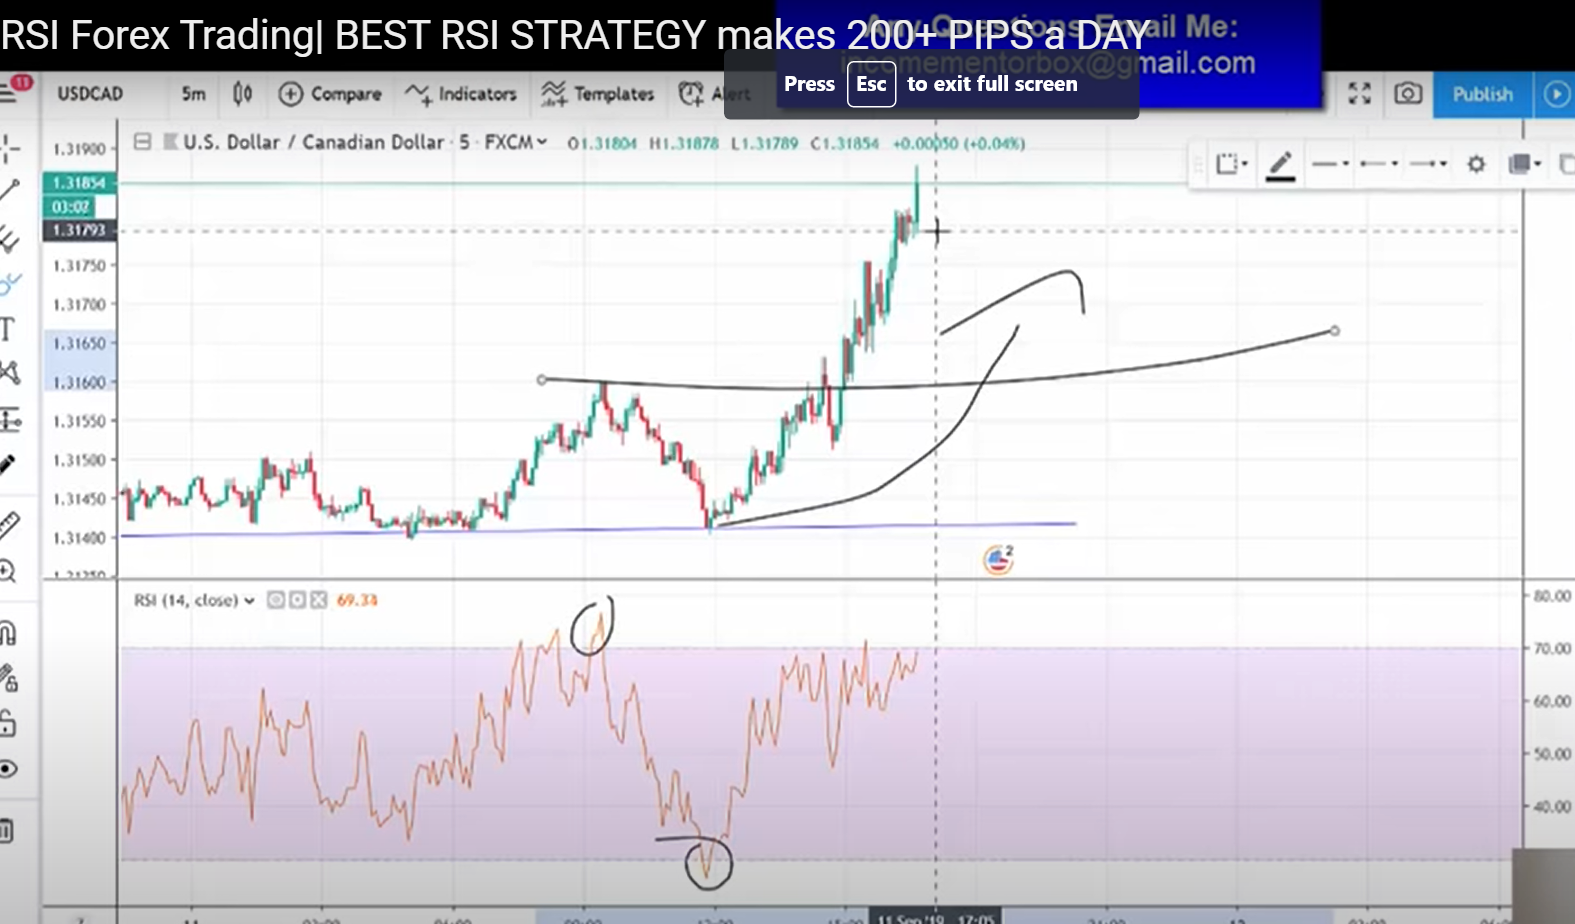
One of the most important things that you need to know here is that when the relative strength index provides you with a reading of 70 or above, then it means that an asset is going to become overvalued and/or overbought. On that same note, if the RSI provides you with a reading of 30 or below 30, then it indicates that an asset is oversold or undervalued. In other words, if the RSI goes past the horizontal 30 level, then it is generally a bullish sign, but when it goes below the 70 reference level, then it is generally a bearish sign.
VISIT ANDREW’S TRADING CHANNEL
Moreover, when there is a trend, the RSI can fall into a band or range. Now, when there is a downtrend going on, the RSI will usually never exceed 70, and will often hit the 30 mark, or well below it. On the other hand, if there is an uptrend going on, the RSI will usually always stay above 30, and it should also hit 70 quite often.
To provide you with a rough example of this, if there is a downtrend, and you see that the relative strength index never reaches 30 or below, and that it rallies to 70 or higher, then it is a strong indication that the downtrend has weakened and will likely reverse into an uptrend. The exact opposite is the case with an uptrend. What you do also need to know here is that when you use the RSI, using trendlines as well as moving averages in combination with the RSI, does provide you with a variety of benefits.
RSI Limitations
What you need to be aware of here is that the relative strength index does have a couple of drawbacks or limitations. and here is that it can be difficult to separate false alarms from true reversal signals. For example, sometimes a bullish crossover followed by a sudden decline in stock is a false reversal.
What you also need to know here is that because this is a momentum indicator, the values can stay in the overbought or oversold positions for quite some time after an asset has already begun significant momentum in the opposite direction. Because of this, the artist is generally the most useful in an ocellated market where an asset alternates between bullish and bearish price movements.
Tips on Using the Relative Strength Index for Trading
There are of course many different trading strategies that can be used with the RSI, as well as other indicators that work well in conjunction with it. However, the number one tip we can give you is to thoroughly watch all of the videos that we have included here today. Within those three videos, Andrew provides some great trading strategies and tips for profiting with the relative strength index indicator.
However, if there is one thing to remember, it’s that using the RSI is much more reliable when you combine it with support and resistance. It helps you identify reversals much easier and also helps prevent false signals from occurring. Fort instance, if an asset is undersold at the 30 line, then look for major support to confirm the reversal.
Final Thoughts on the Relative Strength Index
Now that you know the basics of the relative strength index, you can start using it to place profitable trades on both bullish and bearish reversals. We do really recommend taking a closer look at all three of the videos that we have included today.
If you need help day trading, and what you need is a comprehensive education, particularly on Forex trading, then the best place to be is the Income Mentor Box Day Trading Academy. At this time, the IMB Academy is the most comprehensive, user friendly, effective, and affordable Forex trading school out there.
CLICK BELOW TO JOIN INCOME MENTOR BOX AND START MAKING REAL PROFITS!

Leave a Reply