Trading Forex with Candlestick Patterns
OFFICIAL SITE: INCOMEMENTORBOX.COM
If you want to trade Forex and actually make money, one good way is to know what candlestick graphs are, and how to identify candlestick patterns. If you don’t know how to do this, well, you are about to find out. Let’s get to it and give you the lowdown on candlestick patterns and graphs so you can start winning trades!

A Lowdown on Candlestick Patterns & Graphs
So, you are probably wondering what the exact purpose of candlestick patterns is. Well, candlestick graphs are designed to provide you with a detailed overlook of past price movements of currencies, securities, and more.
This is perfect for Forex trading, as you can observe past price movements and therefore make predictions for the future. If you know how to read these graphs and recognize various candlestick patterns, you can then make price predictions for the future, therefore allowing you to make profitable trades, whether Forex or otherwise.
There are a couple of small things that you should know about candlestick patterns, mainly the components of them and what all of those little parts are. Each candlestick graph displays the market’s open, high, low, and closing price. The “real body” of the candle is the wide part, what looks like the candle’s body.
The real body signifies the price change or price range between the open and close of the day, which could be a currency or otherwise. If the candle is filled in, it means the closing price was lower than the opening price. If the candle is not filled in, it means that the closing price was higher than the opening price. Most trading software will shade in down candles red and up candles green.
Bullish Candlestick Patterns
Let’s go over some of the most basic bullish candlestick patterns that you will come across when analyzing this type of graph
Hammer
The hammer candlestick pattern actually has the same shape as the hanging mad pattern, with the difference being that this hammer pattern occurs in a downtrend, whereas the hanging man occurs in an uptrend.
Inverted Hammer
This is a candlestick pattern that is usually observed at the end of a downtrend. It’s very similar to the shooting star pattern. The difference is the position in which it occurs.

Dragonfly Doji
This is a party bullish pattern. Here, open, high, and close prices are the same. This pattern implies that buyers and sellers were in a tough fight, and that buyers were able to push the prices to the closing price.
Bullish Engulfing
This bullish candlestick pattern is usually seen at the end of a downtrend. A large green candle engulfs a smaller red candle which shows the strength of the bulls. The prior bearish trend converts to a bullish trend.
Piercing Pattern
Similar to the bullish engulfing pattern, both appear at the end of a downtrend. The difference is that the green candle does not fully engulf the red candle.

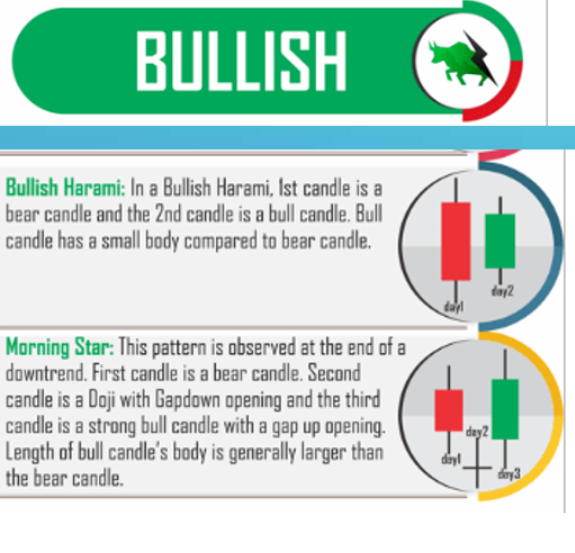
Morning Star
This is a pattern often observed at the end of a downtrend. The first candle is a bear candle, and the second candle is a Doji with a gap down opening, and the third is a strong bull candle with a gap up opening. The length of the bull candle’s body is usually larger than the bear candle.
Bullish Harami
In this particular candlestick pattern, the first candle is a bear candle and the second a bull candle. The bull candle has a small body compared to the bear candle.
Bearish Candlestick Patterns
Let’s go over some of the most basic bearish candlestick patterns that you will come across when analyzing this type of graph.
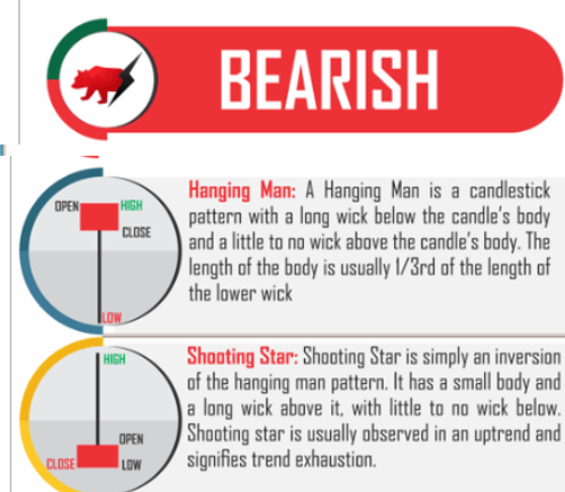
Hanging Man
This is a candlestick pattern with a long wick below the candle’s body and little to no wick above the candle’s body. The length of the body is usually about 1/3 the length of the lower wick.
Shooting Star
This is actually an inversion of the hanging man pattern. It has a very small body with a long wick above the body, with little to no wick above the body. This is something that is usually observed in an uptrend, and it signals trend exhaustion.
Gravestone Doji
This is a partly bearish pattern. Open, close, and low prices are all the same here. This implies that buyers and sellers were in a fight, and by the end of the day, sellers were able to push the prices back to the opening price.
Bearish Engulfing
This bearish candlestick pattern is usually seen at the end of an uptrend. A large red candle engulfs a smaller green candle which shows the strength of the bears. The prior bullish trend converts to a bearish trend.
Dark Cloud Cover
This is a similar candlestick pattern to the bearish engulfing pattern because they both usually appear at the end of an uptrend. The difference is that the red candle doesn’t completely engulf the green candle.

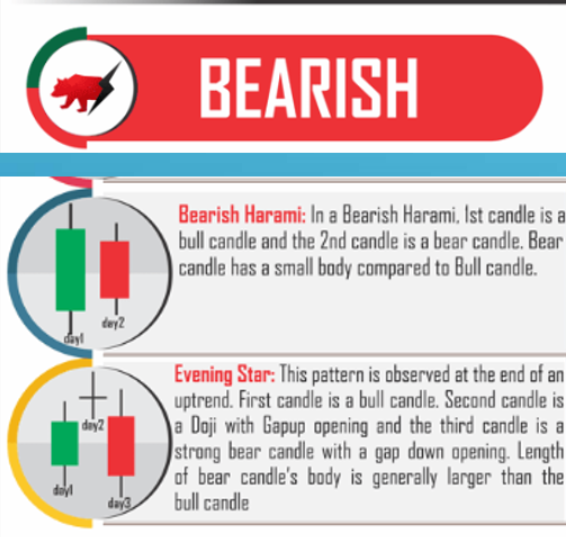
Evening Star
This is a candlestick pattern often seen at the end of an uptrend. The first candle is a bull candle, the second is a Doji with a gap up, and the third candle is a strong bear with a gap down opening. The length of the bear candle is generally longer than that of the bull candle.
Bearish Harami
In this particular candlestick pattern, the first candle is a bull candle and the second a bear candle. The bear candle has a small body compared to the bull candle.
Reading Candlestick Patterns & Graphs – Conclusion
The bottom line is that if you want to trade Forex properly and profitably, being able to read candlestick graphs and identify various candlestick patterns is a really big deal. Today we have gone over the basics, as well as a variety of patterns, but of course, the only way you will really learn how to get it right is through practice. Moreover, if you truly want to become a pro day trader, whether Forex or otherwise, joining the Income Mentor Box Day Trading Academy is highly recommended.
CLICK BELOW TO JOIN INCOME MENTOR BOX AND START MAKING REAL PROFITS!

If you would like to find out more about cryptocurrencies and cryptocurrency trading, go to our Cryptocurrency Explained section!

Leave a Reply