An Introduction to Candlestick Patterns
If you are just starting to trade, whether it is forex, stock market, crypto currencies, or anything in between, one of the things that you definitely need to know about our candlestick patterns. The fact of the matter is that when it comes to identifying the best times and places to execute trades, candlestick patterns are some of the most useful tools out there.
In terms of beginner friendly trading techniques that will allow you to place trades with relative ease and security, candlestick patterns are extremely useful.
These Japanese style trading patterns are designed to provide you with a plethora of information of, more or less everything you need in order to place profitable trades with ease. Let’s get to it and take a closer look at Candlestick patterns to see exactly what they are, what they tell you, and how they can put money in your pocket.
What are Candlestick Patterns
OK, so candlestick patterns are the patterns of candles that you see on a candlestick chart. Now, the candlestick chart was first invented lock a long time ago, in the 1700s by Japanese man who saw that there was a close relation between the price of rice and its supply and demand. This is a very special type of chart that is used by a whole lot of traders, and it is used to determine the possible price movement based on past patterns.
Moreover, another thing that candlestick patterns aim to extrapolate from the charts is what the emotions of traders are like. This is one of the big advantages that you get with this type of trading tool, that it actually shows you what the trading sentiment and emotion is like at any given time.
These candlesticks provide us with lots of different information, specifically, four pieces of information, including the close and the open, and the low and a high of a specific security or asset during a certain period of time that the trader him or herself as specified.
Now, there are quite literally hundreds of different Candlestick patterns that you need to know in order to be a proficient Candlestick trader. However, before you can start learning about these various patterns, you first need to know what the various components of these candlesticks are. You also need to know what the advantages and disadvantages of using this kind of tool for trading are.

Candlestick Components
Alright, so in order for you to be able to identify the various candlestick patterns out there, what you first need to be able to do is to read individual candles themselves.
Once again, keep in mind that these candlestick patterns show you four different pieces of information including what the price was at the open of the day and at the close of the day, as well as what the highest and the lowest price traded at during the day. When you look at an individual candle, all of these four pieces of information are represented by something slightly different.

The main component of a candlestick is a very wide part, which is called the real body, and this real body represents the range of a price between the open and the closed for a day. Now if the real body is either filled in or totally black, it usually indicates that the close was lower than the open, but if the real body is empty, it shows that close was higher than the open.
The other component of the candlestick that we need to be aware of are the upper and the lower wicks. The upper and lower wicks represent the highest and lowest prices trading at during the day. Keep in mind that in many cases a down candle will be traded red and up candles are faded green.
Advantages and Disadvantages of Candlestick Charts
Before we provide you with a couple of examples of some of the most common Candlestick patterns out there, we do want to go over the main advantages and disadvantages that come along with this type of trading tool.

Pros
- Candlestick patterns are extremely visual, aesthetically pleasing, and easy to read. This is one of the most user-friendly and beginner friendly ways of trading.
- Another big advantage is that the vast majority of indicators work really well with this type of chart.
- What’s also really cool about this type of chart is that they are highly customizable, and one single candle can represent any period of any asset.
- Candlestick patterns also tend to be extremely accurate and useful because they provide you with so many different types of information.
- When it comes to identifying market sentiment and emotion, as well as who is in control of the market, this is by far one of the best tools out there.
Cons
- One issue here is that many people will tend to see patterns where they don’t actually exist. This is a bias that human brains have, where we try to see patterns where they do not actually exist.
- Just don’t make the mistake of thinking that you only need candlestick patterns to place proper trades. Price data alone is generally not enough to place extremely accurate trades, and you do want to be using indicators.
- The other issue is that candlesticks can sometimes have gas, or in other words one candlestick my close at a certain point, but the other one doesn’t open until a different point. This may leave you wondering what happened in between.
VISIT ANDREW’S TRADING CHANNEL
Two Basic Candlestick Patterns
We will be doing a second part where we are going to cover all of the most common Candlestick patterns out there, but for now we just want to provide you with a basic example of what they look like.
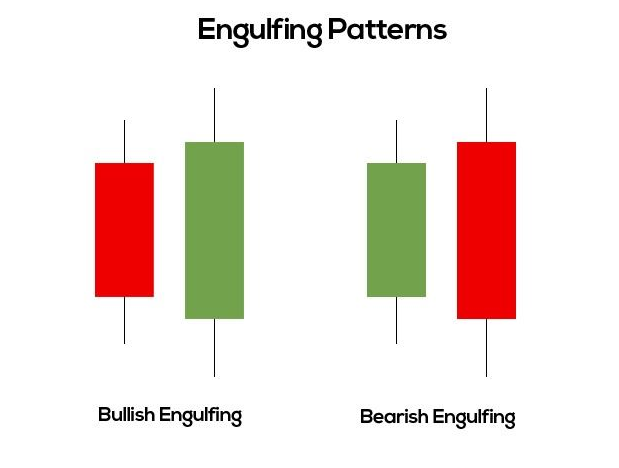
Bullish or Bearish Engulfing Pattern
One of the most basic Candlestick patterns that you might come across is called the bearish engulfing pattern. This is a pattern that develops in an uptrend, which means that there are more sellers than buyers. Within this pattern, you’ll see a long red real body that engulfs a smaller green real body. This pattern indicates that sellers are in control and that the price will continue to decline.
On the other hand, we have the bullish engulfing pattern, and this is generally an indication that the buyers outnumber the sellers. Here you will see a long green real body that involves a small red real body. This indicates that the bulls established more control in the market and that the price will very likely continue to increase.

An Intro to Candlestick Patterns – Final Thoughts
We hope that we have provided you with enough information about these Candlestick patterns to get started. Do remember that we will be doing a second part to this topic, one where we will cover all of the most common candlestick patterns that you might encounter. Remember that these patterns are extremely useful when it comes to identifying the best possible trades to place at any given time.
If you need help day trading, and what you need is a comprehensive education, particularly on Forex trading, then the best place to be is the Income Mentor Box Day Trading Academy. At this time, the IMB Academy is the most comprehensive, user friendly, effective, and affordable Forex trading school out there.
CLICK BELOW TO JOIN INCOME MENTOR BOX AND START MAKING REAL PROFITS!

Leave a Reply