A Crash Course on Bullish Candlestick Patterns
If you plan on being a profitable trader, knowing all about technical analysis is extremely important. As far as technical analysis is concerned, one thing that you need to be aware of are candlestick patterns. Candlestick charts are extremely common in the world of trading, and this goes for all markets.
The simple reality is that candlestick patterns are great for determining when and where to place your trades. Technically speaking, they are ideal for identifying trends and for identifying trend reversals. With that being said, there are many different candlestick patterns out there for you to know, and you need to know how to read them. Today, we want to do a crash course on candlestick patterns, specifically bullish candlestick patterns.
We’re going to tell you exactly how to identify bullish candlesticks, and how to read these charts in general. Let’s get to it and teach you exactly how to read bullish candlestick patterns, plus we’ve got some great examples for you to look at too.
A Crash Course on Candlesticks
Candlestick charts were invented in Japan, and they have been used in the western trading world for over 100 years period in fact, they have been used in Asia for well over that amount of time. What you need to know about Candlestick patterns is that they tell you four different things, which include both the opening and the closing price of security, as well as the lowest price and the highest price traded at on a given day.
The main part of the candle, the large rectangle, is known as the body or the real body. This displays the link between the opening price and the closing price for a given day. It also shows you the price range of a security from the open and the close of a particular day.
Keep in mind that if the real body of a candle is black, red, or filled in, it is a sign that the closing price was lower than the opening price, and this is what is known as a bearish candle. This indicates that while the price opened high, the bears then push the price down, therefore causing the price to close at a lower price than they open.
on the other hand, if the body of the real candle is white, green, or empty, it is a sign that the closing price was much higher than the opening price, and this is known as a bullish candle, which is what we are here to analyze today. This is a sign that the price open low, and the bulls then push the price higher, therefore causing it to close at a higher level than it opened.
Those small, thin, and vertical lines that you see both above and below the bodies of candles are known as shadows or Wicks. These tell you what the highest and the lowest price was that an acid was traded at in a given day. Do remember that bullish candles are generally always green, and they represent strength in the market.
CLICK ON IMAGE TO GET FOREX SIGNALS

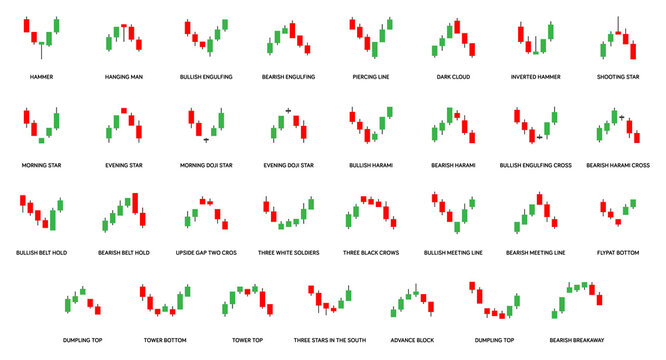
5 Essential Bullish Candlestick Patterns
What we want to do right now is take a look at the five most common bullish candlestick patterns that you are likely to come across.
CLICK ON IMAGE TO GET THE ULTIMATE PROFIT SCALPING INDICATOR

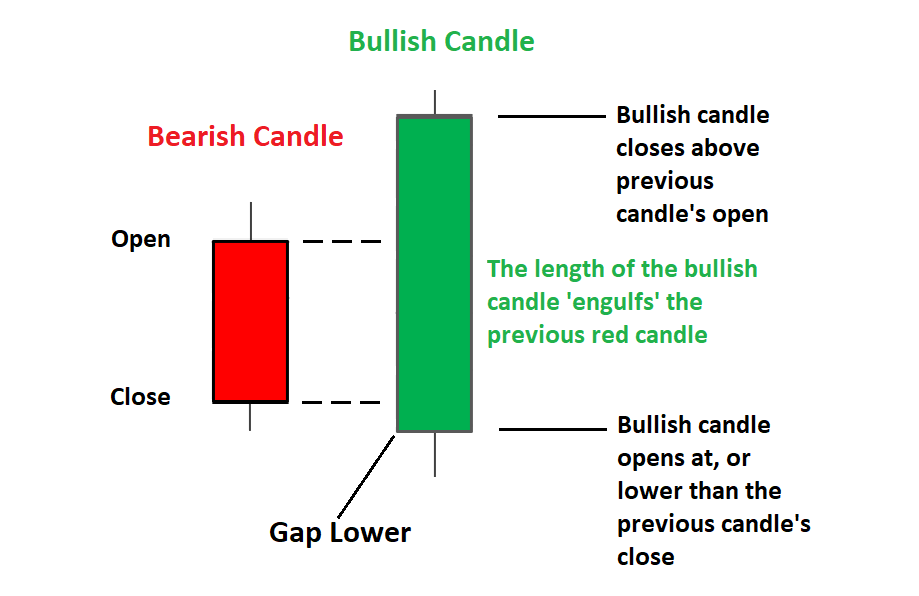
Bullish Engulfing
one of the most common bullish candlesticks out there is known as bullish engulfing. The bullish engulfing pattern is formed by multiple candlesticks, and it is formed after a downtrend, and of course it signifies that a bullish reversal is on the horizon. Here, this pattern is characterized by two candles, the second of which fully engulfs the first one.
The first candle is a bearish candle which indicates a downtrend, with the second candle being much larger and longer. The second candle completely is bullish and completely covers the first one, and it shows that the bulls are in power.
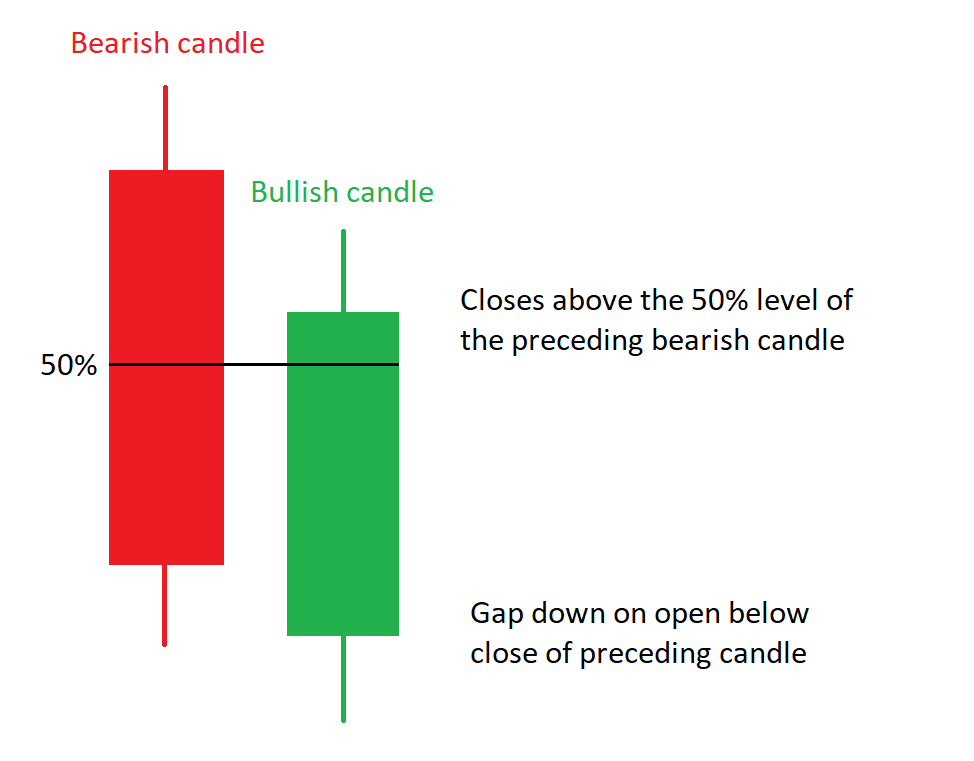
Piercing Pattern
The second of the bullish candlestick patterns need to know about is known as bullish peers at the this isn’t the downtrend, and also signifies a bullish reversal. Here, you will also see two candles, with the first one being a bearish candle, and the second one being a bullish candle.
The first candle signifies a continuing downtrend, but the second candle then signifies a reversal to an uptrend. the second candle is a bullish candle that opens gap down, with the close being more than 50% of the real body of the previous candle. It’s another indication that the bulls currently have control of the market.
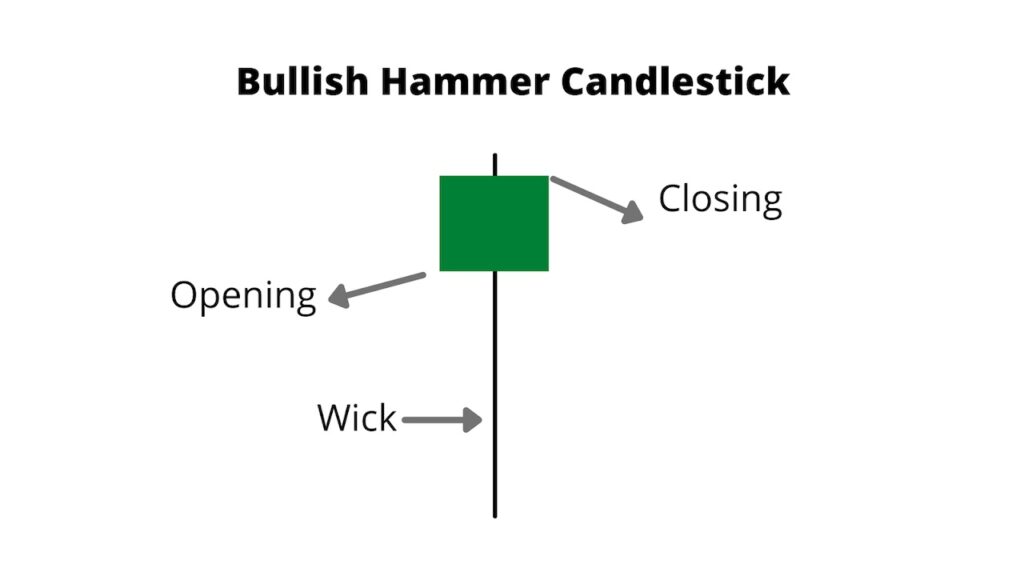
The Hammer
Yet another one of the most common candlestick patterns out there that is bullish is known as the hammer. This pattern also forms at the end of a downtrend, and it of course also signifies that a bullish reversal is going to happen.
Here, you will see a candle that actually looks like a hammer, with a fairly short body, with a Wick that is at least twice as long as the body. This candle will also have either no or a very little upper shadow.
This pattern indicates that the price opened fairly high, with the sellers then pushing the price down, but with the buyers then suddenly coming back into the market and pushing the price back up one final time.
The result here is that the price closed at a higher level than it opened. This is an indication that buyers are putting strong pressure on the market.
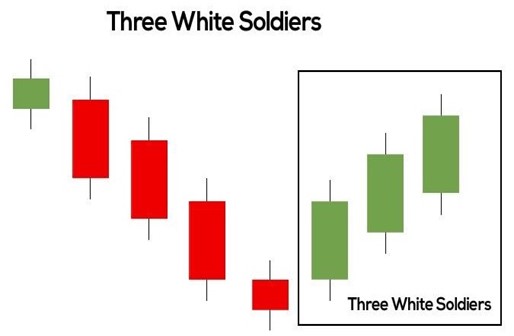
Three White Soldiers
The 4th bullish candlestick pattern is the three white soldiers pattern. This is a bullish pattern that features three different candlesticks, each one with a very long bullish body.
These candles don’t have any Wicks, and are all open, with the real body of each candle opening around the halfway mark or higher of the last candle. This is one of the strongest indications that abolish reversal is going to happen.
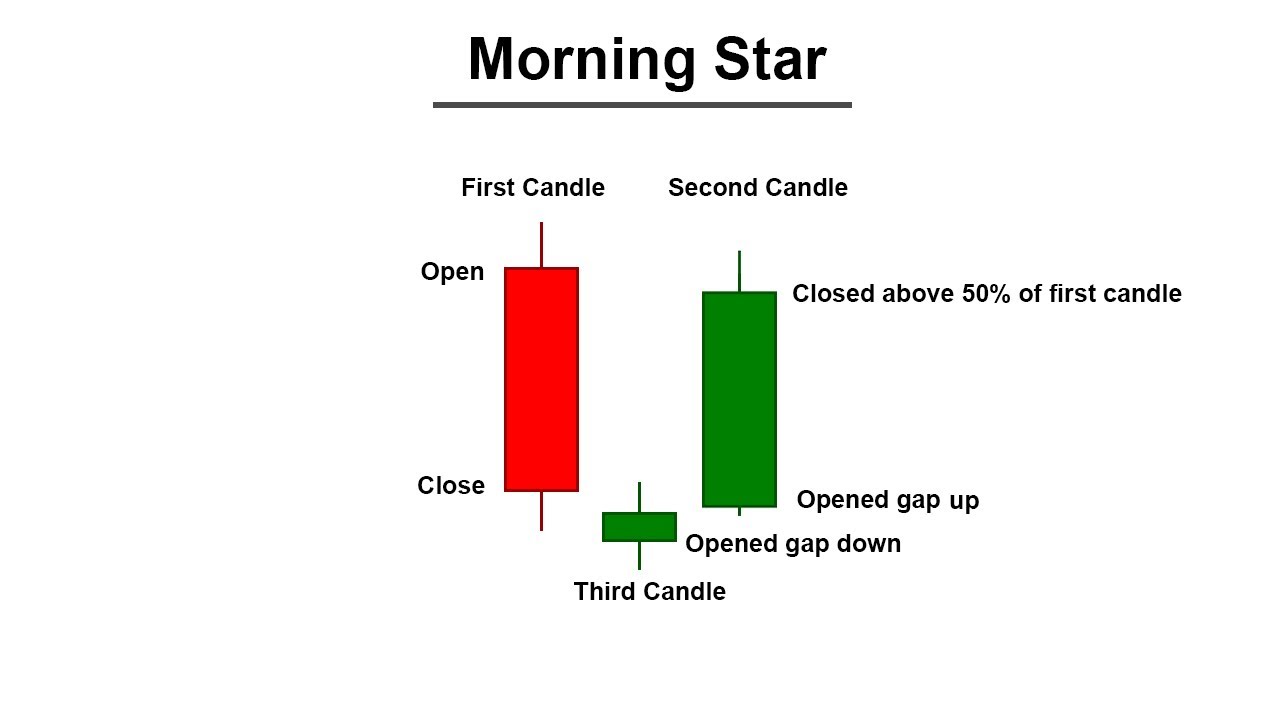
Morning Star
The other bullish candlestick pattern we want to take a look at is known as the Morningstar. This is of course also a sign that a bullish reversal is going to happen in near the end of a downtrend. Here, you will also see three separate candles. The first is a bearish candlestick, the 2nd is a doji candlestick, and the third is a bullish candlestick.
The first candle is an indication that a downtrend will continue, the second candle indicates indecision in the market, and the third candle is a bullish one, which is the sign that a bullish reversal is going to happen. Do remember that the second candle is going to be below and completely out of line with the first and third candle.
The Bottom Line on Bullish Candlesticks
If you learn to recognize these bullish candlestick patterns, you should have no problem seeing a trend reversal and then placing profitable trades based on your analysis.
For more trading tips, strategies, methods, and everything in between, check out Andrew’s Trading Channel. Here you will find the world’s best stock market trading school, a trusted day trading school, state of the art indicators and trading tools, Forex and crypto signals groups, and more!
Leave a Reply